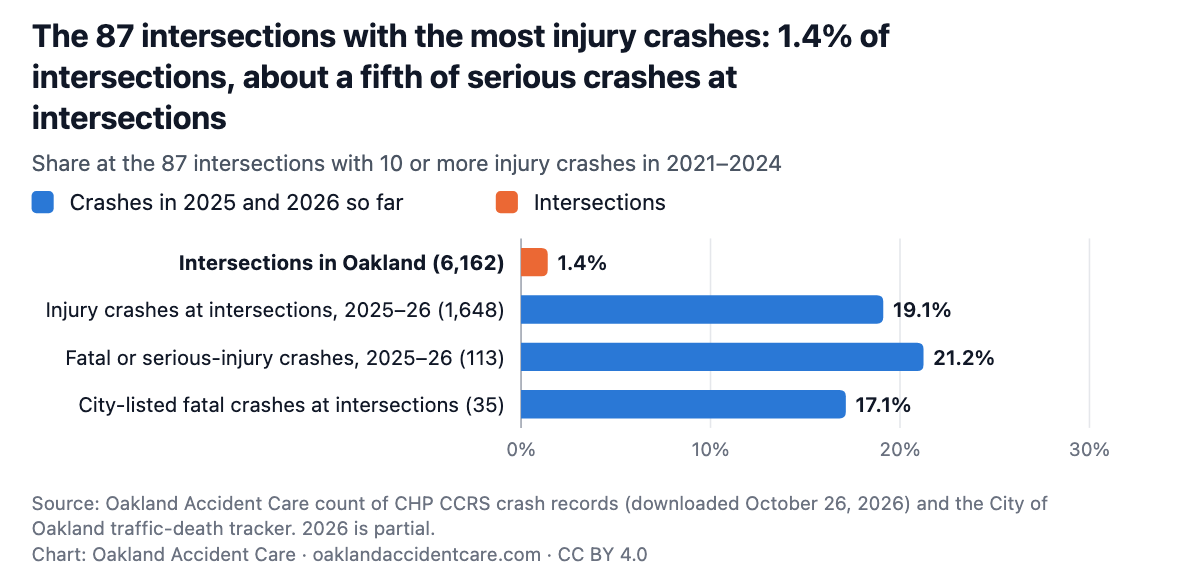
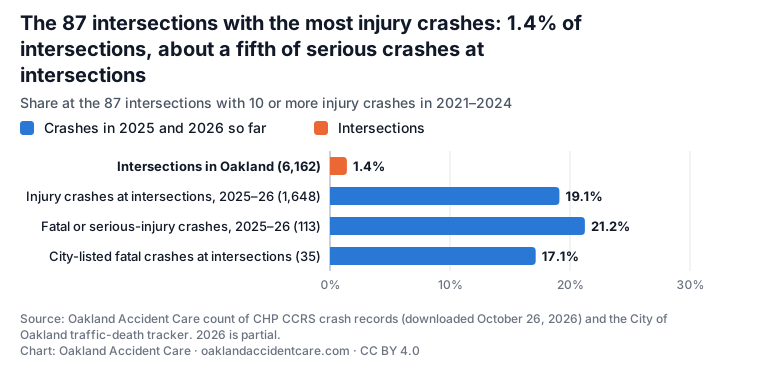
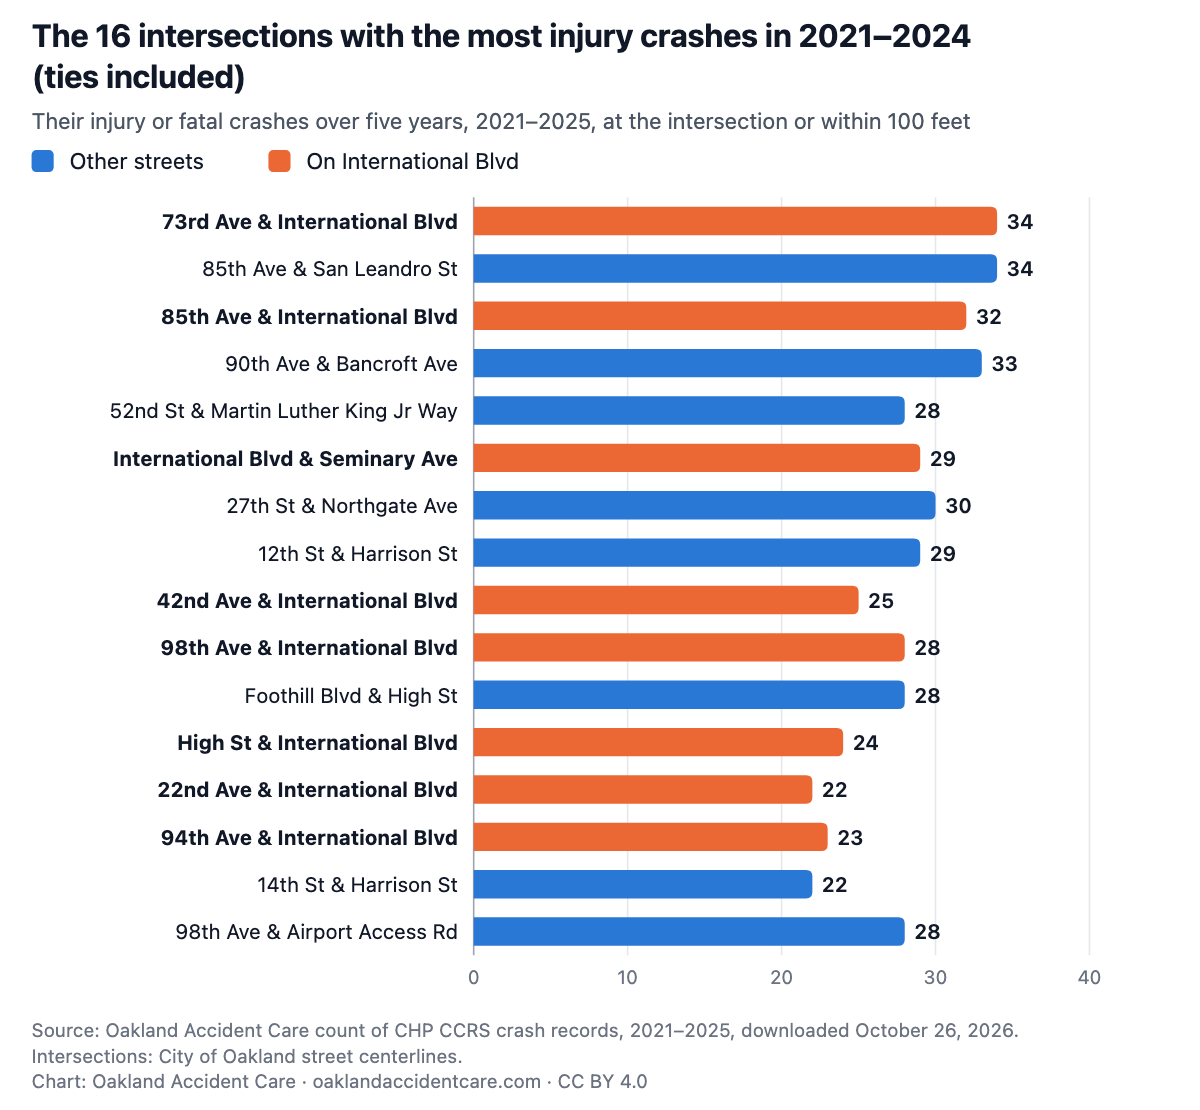
We ranked every intersection in Oakland by its injury crashes in 2021–2024, then looked at where crashes happened next. The 87 intersections with 10 or more, 1.4% of the city’s 6,162, had 24 of the 113 crashes that killed or seriously injured someone at an intersection in 2025 and 2026 so far.
Analysis by Oakland Accident Care, a chiropractic clinic in downtown Oakland.
| Rank | Intersection | District | Injury or fatal crashes, 2021–2024 | Injury or fatal crashes, 2025 | Fatal or serious, 2025–2026 so far | Injury or fatal crashes, 2021–2025 (five years) |
|---|---|---|---|---|---|---|
| 1 | 73rd Ave & International Blvd | District 6 | <5 | <5 | 34 | |
| 2 | 85th Ave & San Leandro St | District 7 | 28 | 6 | <5 | 34 |
| 3 | 85th Ave & International Blvd | District 7 | 26 | 6 | <5 | 32 |
| 3 | 90th Ave & Bancroft Ave | District 7 | 26 | 7 | 0 | 33 |
| 5 | 52nd St & Martin Luther King Jr Way | District 1 | <5 | 0 | 28 | |
| 5 | International Blvd & Seminary Ave | District 6 | <5 | 0 | 29 | |
| 7 | 27th St & Northgate Ave | District 3 | 23 | 7 | 0 | 30 |
| 8 | 12th St & Harrison St | District 2 | 22 | 7 | 0 | 29 |
| 8 | 42nd Ave & International Blvd | District 5 | <5 | <5 | 25 | |
| 8 | 98th Ave & International Blvd | District 7 | 22 | 6 | 0 | 28 |
| 8 | Foothill Blvd & High St | District 5 | 22 | 6 | <5 | 28 |
| 8 | High St & International Blvd | District 5 | <5 | <5 | 24 | |
| 13 | 22nd Ave & International Blvd | District 2 | <5 | 0 | 22 | |
| 13 | 94th Ave & International Blvd | District 7 | <5 | 0 | 23 | |
| 15 | 14th St & Harrison St | District 3 | <5 | 0 | 22 | |
| 15 | 98th Ave & Airport Access Rd | District 7 | 19 | 9 | 0 | 28 |
| 17 | 17th St & Brush St | District 3 | 18 | 5 | 0 | 23 |
| 17 | 38th Ave & International Blvd | District 5 | <5 | <5 | 21 | |
| 17 | 81st Ave & International Blvd | District 6 | <5 | 0 | 20 | |
| 17 | Hamilton St & Hegenberger Rd | District 6 | 18 | 7 | <5 | 25 |
| 21 | 80th Ave & International Blvd | District 6 | <5 | 0 | 20 | |
| 21 | 96th Ave & Bancroft Ave | District 7 | 17 | <5 | 0 | |
| 21 | Baldwin St & Hegenberger Rd | District 7 | <5 | <5 | 19 | |
| 24 | 54th Ave & International Blvd | District 5 | 16 | <5 | <5 | |
| 24 | 66th Ave & San Leandro St | District 6 | 16 | 6 | 0 | 22 |
| 24 | 73rd Ave & Bancroft Ave | District 6 | 16 | 8 | 0 | 24 |
| 27 | Beaumont Ave & MacArthur Blvd | District 4 | 15 | <5 | <5 | |
| 27 | High St & San Leandro St | District 5 | 15 | 8 | <5 | 23 |
| 29 | 21st Ave & Foothill Blvd | District 2 | 14 | <5 | 0 | |
| 29 | 23rd Ave & International Blvd | District 2 | <5 | 0 | 16 | |
| 29 | 35th Ave & International Blvd | District 5 | <5 | 0 | 18 | |
| 29 | 36th St & W St | District 3 | 14 | <5 | 0 | |
| 29 | 64th Ave & Bancroft Ave | District 6 | 14 | <5 | 0 | |
| 29 | 82nd Ave & Bancroft Ave | District 7 | 14 | <5 | <5 | |
| 29 | Foothill Blvd & Fruitvale Ave | District 5 | <5 | 0 | 17 | |
| 29 | Oakland Ave & Santa Clara Ave | District 1 | 14 | 0 | 0 | 14 |
| 37 | 14th St & Adeline St | District 3 | <5 | 0 | 17 | |
| 37 | 21st Ave & International Blvd | District 2 | 13 | <5 | <5 | |
| 37 | 66th Ave & International Blvd | District 6 | 13 | <5 | 0 | |
| 37 | 82nd Ave & International Blvd | District 6 | 13 | <5 | 0 | |
| 37 | 96th Ave & International Blvd | District 7 | 13 | <5 | 0 | |
| 37 | 98th Ave & MacArthur Blvd | District 7 | 13 | <5 | 0 | |
| 37 | Adeline St & W Grand Ave | District 3 | 13 | 5 | <5 | 18 |
| 37 | Edes Ave & Hegenberger Rd | District 7 | 13 | <5 | 0 | |
| 37 | Foothill Blvd & Havenscourt Blvd | District 6 | 13 | <5 | 0 | |
| 37 | Fruitvale Ave & Harold St | District 5 | <5 | 0 | 15 | |
| 37 | Telegraph Ave & W Grand Ave | District 3 | 13 | 0 | 0 | 13 |
| 48 | 100th Ave & International Blvd | District 7 | 12 | 0 | 0 | 12 |
| 48 | 14th St & Jefferson St | District 3 | 12 | <5 | 0 | |
| 48 | 27th St & Broadway | District 3 | 12 | <5 | 0 | |
| 48 | 33rd Ave & International Blvd | District 5 | 12 | 0 | 0 | 12 |
| 48 | 50th Ave & International Blvd | District 5 | 12 | <5 | 0 | |
| 48 | 73rd Ave & Arthur St | District 6 | 12 | <5 | 0 | |
| 48 | 92nd Ave & International Blvd | District 7 | 12 | 0 | 0 | 12 |
| 48 | 98th Ave & Edes Ave | District 7 | 12 | <5 | 0 | |
| 48 | Fruitvale Ave & International Blvd | District 5 | <5 | 0 | 13 | |
| 48 | Market St & W Grand Ave | District 3 | <5 | 0 | 13 | |
| 58 | 14th Ave & International Blvd | District 2 | 11 | <5 | 0 | |
| 58 | 14th St & Brush St | District 3 | <5 | 0 | 12 | |
| 58 | 14th St & Castro St | District 3 | 11 | <5 | 0 | |
| 58 | 18th St & Market St | District 3 | <5 | 0 | 13 | |
| 58 | 27th St & Telegraph Ave | District 3 | 11 | <5 | 0 | |
| 58 | 42nd Ave & Foothill Blvd | District 5 | 11 | 0 | 0 | 11 |
| 58 | 68th Ave & Foothill Blvd | District 6 | 11 | <5 | 0 | |
| 58 | 7th St & Oak St | District 2 | 11 | <5 | 0 | |
| 58 | 98th Ave & Maddux Dr | District 7 | 11 | 0 | 0 | 11 |
| 67 | 10th St & Adeline St | District 3 | 10 | 0 | 0 | 10 |
| 67 | 12th St & Broadway | District 2 | 10 | <5 | 0 | |
| 67 | 14th St & Mandela Pkwy | District 3 | 10 | 0 | 0 | 10 |
| 67 | 16th Ave & E 12th St | District 2 | 10 | 0 | 0 | 10 |
| 67 | 18th St & Brush St | District 3 | <5 | 0 | 12 | |
| 67 | 34th Ave & International Blvd | District 5 | 10 | <5 | 0 | |
| 67 | 35th St & Market St | District 3 | 10 | <5 | 0 | |
| 67 | 38th Ave & Foothill Blvd | District 5 | <5 | 0 | 13 | |
| 67 | 50th Ave & Bancroft Ave | District 5 | 10 | <5 | <5 | |
| 67 | 55th Ave & Foothill Blvd | District 6 | 10 | <5 | 0 | |
| 67 | 57th Ave & International Blvd | District 6 | 10 | <5 | 0 | |
| 67 | 5th Ave & E 18th St | District 2 | 10 | <5 | 0 | |
| 67 | 72nd Ave & International Blvd | District 6 | 10 | <5 | 0 | |
| 67 | 73rd Ave & Orral St | District 6 | 10 | <5 | 0 | |
| 67 | 77th Ave & Bancroft Ave | District 6 | 10 | <5 | 0 | |
| 67 | 78th Ave & International Blvd | District 6 | 10 | <5 | <5 | |
| 67 | 7th St & Webster St | District 2 | 10 | <5 | <5 | |
| 67 | 98th Ave & D St | District 7 | 10 | <5 | 0 | |
| 67 | Bancroft Ave & Church St | District 6 | 10 | <5 | <5 | |
| 67 | Grand Ave & Harrison St | District 3 | 10 | 0 | 0 | 10 |
| 67 | Havenscourt Blvd & International Blvd | District 6 | 10 | <5 | 0 |
Copy this HTML. It shows the PNG and links back to this page, as the CC BY 4.0 license asks.
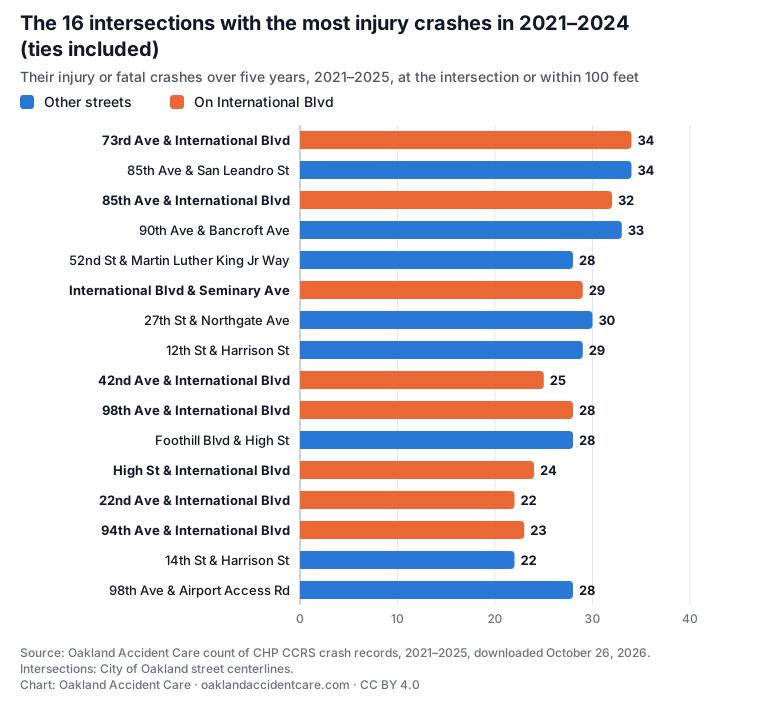
<figure style="margin:0;max-width:760px"><a href="https://oaklandaccidentcare.com/oakland-crash-data/danger-corners#cor-top"><img src="https://oaklandaccidentcare.com/data/oakland-crashes/charts/cor-top.png" alt="Horizontal bar chart of the 16 Oakland intersections with the most injury or fatal crashes in 2021–2024, with their five-year counts, 2021–2025: 73rd Ave & International Blvd 34; 85th Ave & San Leandro St 34; 85th Ave & International Blvd 32; 90th Ave & Bancroft Ave 33; 52nd St & Martin Luther King Jr Way 28; International Blvd & Seminary Ave 29; 27th St & Northgate Ave 30; 12th St & Harrison St 29; 42nd Ave & International Blvd 25; 98th Ave & International Blvd 28; Foothill Blvd & High St 28; High St & International Blvd 24; 22nd Ave & International Blvd 22; 94th Ave & International Blvd 23; 14th St & Harrison St 22; 98th Ave & Airport Access Rd 28." width="1200" style="width:100%;height:auto"></a><figcaption style="font-size:13px">Source: Oakland Accident Care analysis of California Highway Patrol CCRS crash records (CC BY 4.0). <a href="https://oaklandaccidentcare.com/oakland-crash-data/danger-corners">The 87 Oakland intersections with the most injury crashes had about one in five of the serious crashes at intersections in 2025 and 2026. More than half happened at corners with little crash history.</a></figcaption></figure>| Intersection’s injury crashes, 2021–2024 | Fatal crashes, 2025 and 2026 so far (City tracker) | Deaths |
|---|---|---|
| 10 or more | 6 | 8 |
| 5 to 9 | 11 | 12 |
| Fewer than 5 | 18 | 18 |
| Not at an intersection | 5 | 5 |
| All | 40 | 43 |
The full method for every table is in methods.txt.
One file per table. Counts from 1 to 4 are written “<5”. The script that builds every table is tools/crash-analysis.py; it downloads the same public files.
Oakland Accident Care, “The 87 Oakland intersections with the most injury crashes had about one in five of the serious crashes at intersections in 2025 and 2026. More than half happened at corners with little crash history.” November 1, 2026, https://oaklandaccidentcare.com/oakland-crash-data/danger-corners. Data: California Highway Patrol, California Crash Reporting System (CCRS), California Open Data Portal, downloaded October 26, 2026.
Our tables, CSV files and charts are under Creative Commons Attribution 4.0 (CC BY 4.0): reuse them, including commercially, with credit to Oakland Accident Care and a link to this page. The underlying CCRS records are public domain.
Oakland Accident Care · 435 8th Street, Suite 203, Oakland, CA 94607
(510) 606-0007 · oaklandaccidentcare@gmail.com
Call to schedule
Same-day appointments · Appointments · Services · Why choose us · Reviews · Blog
Oakland Accident Care is a service of Glass Velichko Chiropractic P.C. © 2026 · Privacy · Terms · For attorneys
This site is general information, not medical or legal advice. If you are having a medical emergency, call 911.