Oakland crash data · Our analysis

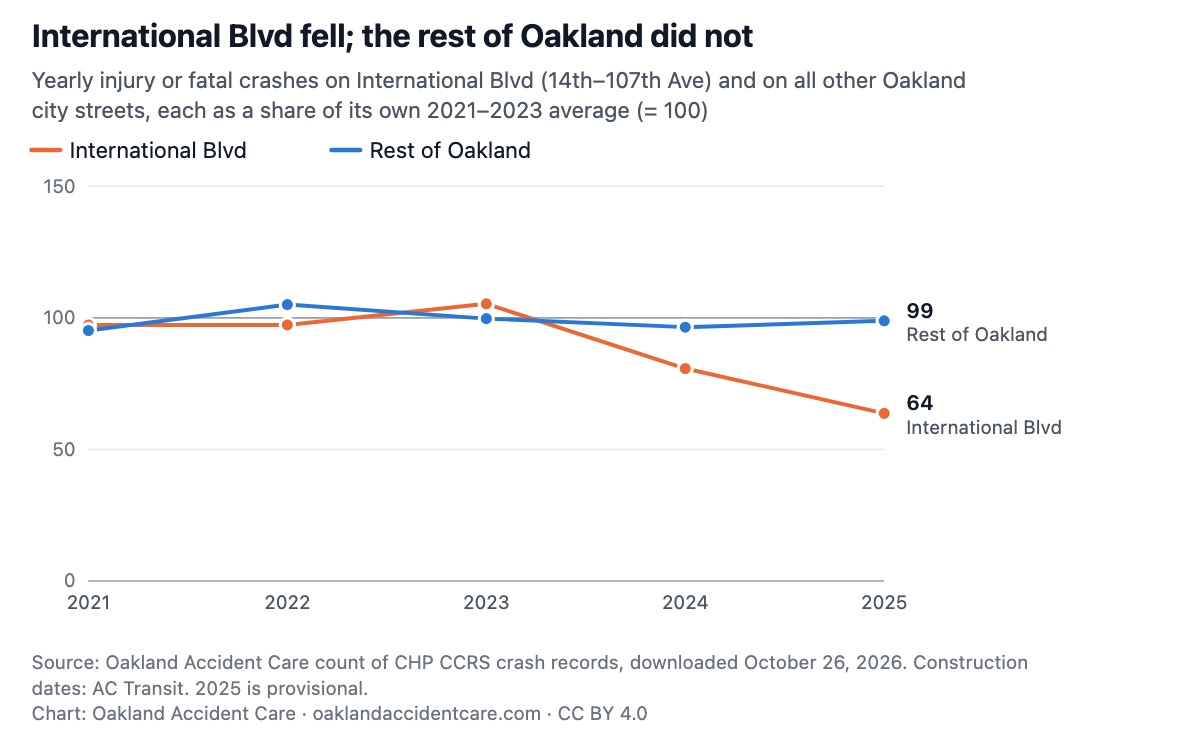
International Blvd logged about a third fewer injury crashes in the year after its quick-build. The rest of Oakland held steady.

From 14th Avenue to 107th Avenue, police reported 127 injury or fatal crashes in 2025, against an average of 199 a year in 2021–2023. Over the same years the rest of Oakland’s city streets went from 1,342 to 1,327 a year.

Analysis by Oakland Accident Care, a chiropractic clinic in downtown Oakland.

Published November 1, 2026 · State crash records downloaded October 26, 2026 · 2025 provisional, 2026 partial (crashes through 2026-10-23)

Key findings

  1. In 2025, police reported 127 injury or fatal crashes on International Blvd between 14th and 107th Avenue, 36% fewer than the average of 199 a year in 2021–2023, the three full years before construction began in July 2024. Table 1[1][5]
  2. On every other city street in Oakland, the count went from 1,342 a year to 1,327, a change of −1%. Table 1[1]
  3. Counted by month, the corridor averaged 16.0 injury crashes a month in the 42 months before construction and 10.9 a month in the 14 months after it was finished (−32%); the rest of Oakland went from 110.4 to 110.6. Table 2[1][6]
  4. Crashes involving a pedestrian on the corridor went from an average of 38 a year in 2021–2023 to 20 in 2025. Crashes that killed or seriously injured someone were too few to compare: 19 a year before, 15 in 2025. Table 1[1]
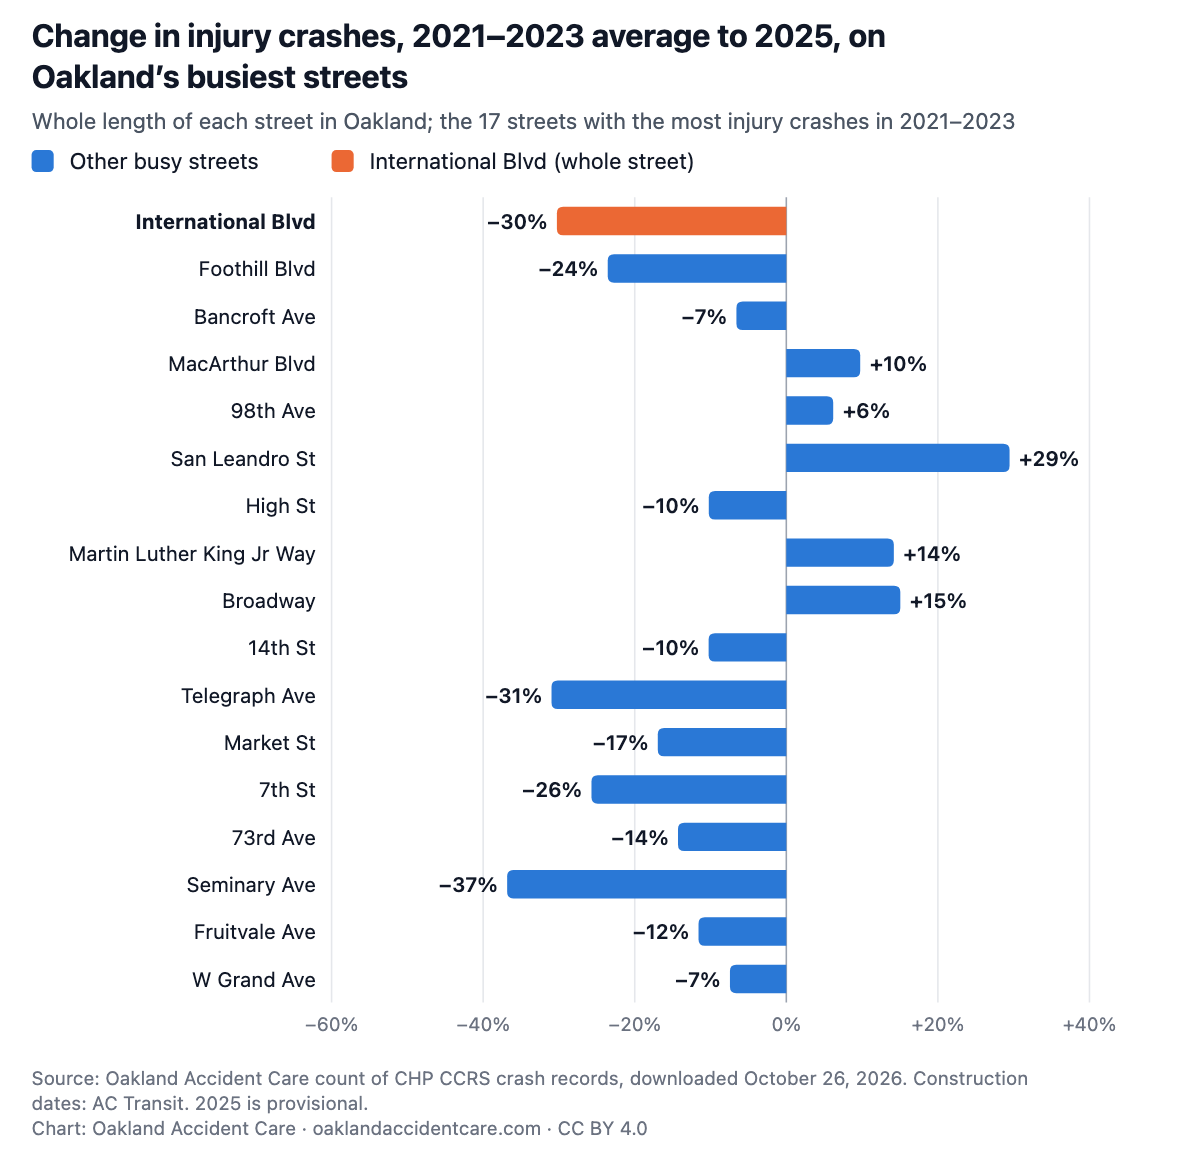
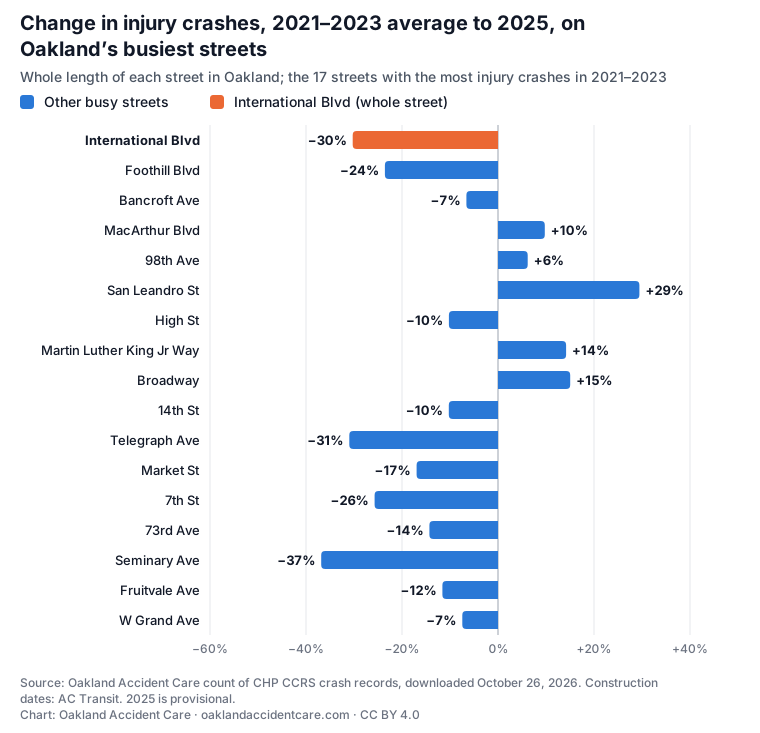
  5. Two of the 16 next-busiest streets, Telegraph Ave and Seminary Ave, fell by a similar or larger share between 2021–2023 and 2025 than International Blvd did, each counted along its whole length (International Blvd: −30% that way), on much smaller counts. Table 4[1]

Charts and the tables behind them

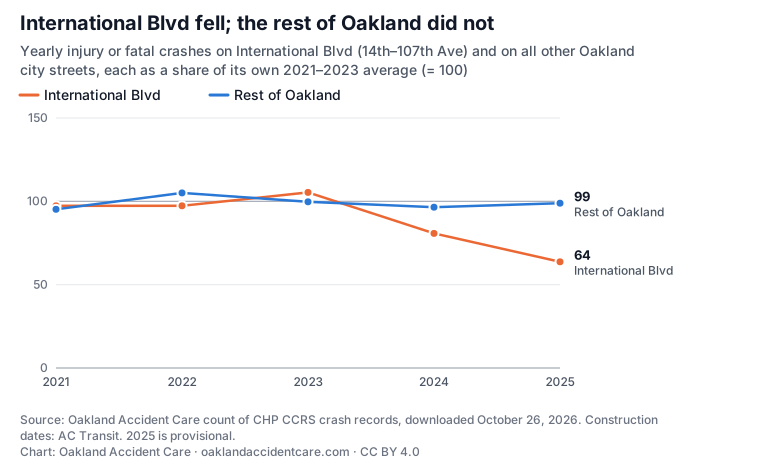
International Blvd fell; the rest of Oakland did notLine chart indexing yearly injury crashes to the 2021–2023 average (100). International Blvd, 14th to 107th Ave, reaches 64 in 2025; the rest of Oakland’s city streets is at 99.International Blvd fell; the rest of Oakland did notYearly injury or fatal crashes on International Blvd (14th–107th Ave) and on all other Oaklandcity streets, each as a share of its own 2021–2023 average (= 100)International BlvdRest of Oakland05010015020212022202320242025International Blvd, 2021: 97International Blvd, 2022: 97International Blvd, 2023: 105International Blvd, 2024: 81International Blvd, 2025: 64Rest of Oakland, 2021: 95Rest of Oakland, 2022: 105Rest of Oakland, 2023: 100Rest of Oakland, 2024: 96Rest of Oakland, 2025: 9964International Blvd99Rest of OaklandSource: Oakland Accident Care count of CHP CCRS crash records, downloaded October 26, 2026. Constructiondates: AC Transit. 2025 is provisional.Chart: Oakland Accident Care · oaklandaccidentcare.com · CC BY 4.0
Download PNG (1200px) · SVG · Data: intl-by-year.csv
Show the numbers
Table 1. Injury or fatal crashes by year, International Blvd (14th–107th Ave) and the rest of Oakland
YearInternational Blvd: injury or fatal crashesInvolving a pedestrianInvolving a bicyclistFatal or serious injuryHit-and-runRest of Oakland: injury or fatal crashesInternational Blvd share of all
2021194321320951,27813.2%
2022194371913841,41012.1%
20232104510251041,33813.6%
2024161321414681,29511.1%
2025 (provisional)127201915471,3278.7%
2026 (partial, through 2026-10-23)4698<5204698.9%
2021–2023 average199.338.019.394.31342.012.9%
Embed this chart

Copy this HTML. It shows the PNG and links back to this page, as the CC BY 4.0 license asks.

<figure style="margin:0;max-width:760px"><a href="https://oaklandaccidentcare.com/oakland-crash-data/international-blvd#intl-index"><img src="https://oaklandaccidentcare.com/data/oakland-crashes/charts/intl-index.png" alt="Line chart indexing yearly injury crashes to the 2021–2023 average (100). International Blvd, 14th to 107th Ave, reaches 64 in 2025; the rest of Oakland’s city streets is at 99." width="1200" style="width:100%;height:auto"></a><figcaption style="font-size:13px">Source: Oakland Accident Care analysis of California Highway Patrol CCRS crash records (CC BY 4.0). <a href="https://oaklandaccidentcare.com/oakland-crash-data/international-blvd">International Blvd logged about a third fewer injury crashes in the year after its quick-build. The rest of Oakland held steady.</a></figcaption></figure>
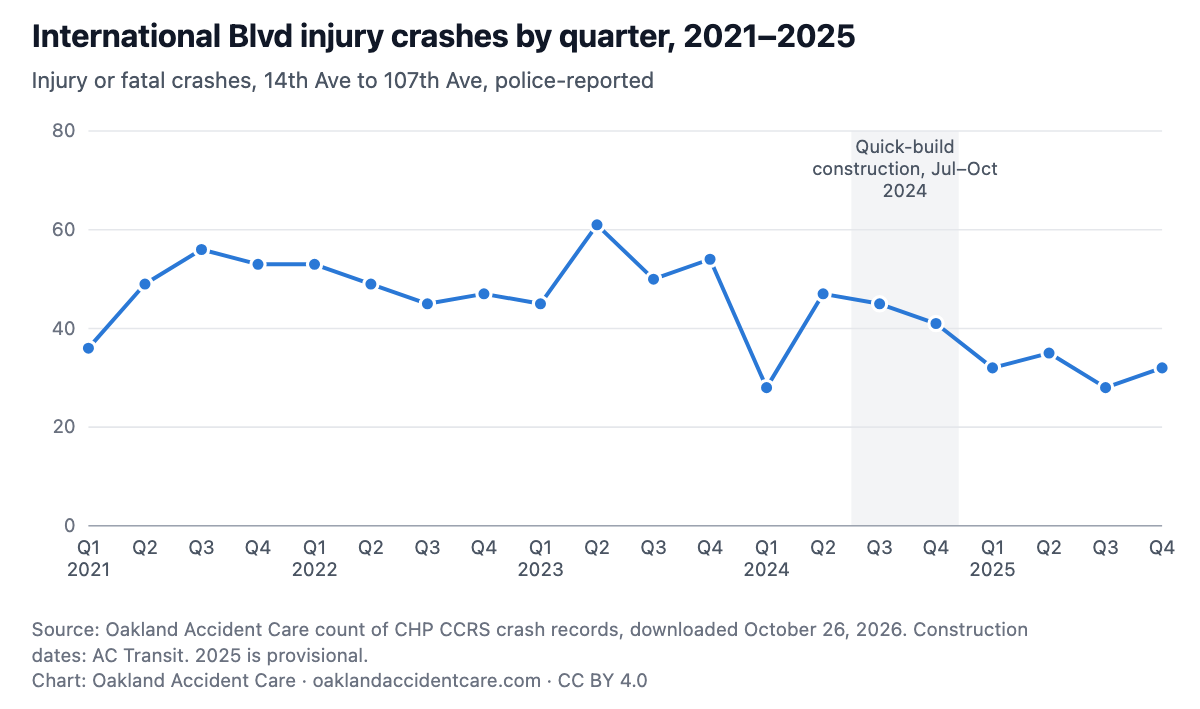
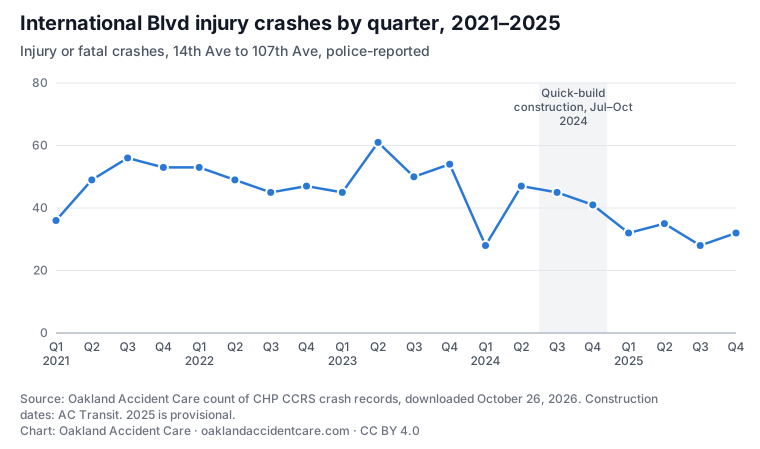
International Blvd injury crashes by quarter, 2021–2025Line chart of injury or fatal crashes per quarter on International Blvd, 14th to 107th Ave, 2021 to 2025. Quarters ran between 36 and 61 in 2021–2023, dropped to 28 in early 2024, and were between 28 and 35 in each quarter of 2025. The construction period, July to October 2024, is shaded.International Blvd injury crashes by quarter, 2021–2025Injury or fatal crashes, 14th Ave to 107th Ave, police-reportedQuick-buildconstruction, Jul–Oct2024020406080Q12021Q2Q3Q4Q12022Q2Q3Q4Q12023Q2Q3Q4Q12024Q2Q3Q4Q12025Q2Q3Q4International Blvd, Q1 2021: 36International Blvd, Q2: 49International Blvd, Q3: 56International Blvd, Q4: 53International Blvd, Q1 2022: 53International Blvd, Q2: 49International Blvd, Q3: 45International Blvd, Q4: 47International Blvd, Q1 2023: 45International Blvd, Q2: 61International Blvd, Q3: 50International Blvd, Q4: 54International Blvd, Q1 2024: 28International Blvd, Q2: 47International Blvd, Q3: 45International Blvd, Q4: 41International Blvd, Q1 2025: 32International Blvd, Q2: 35International Blvd, Q3: 28International Blvd, Q4: 32Source: Oakland Accident Care count of CHP CCRS crash records, downloaded October 26, 2026. Constructiondates: AC Transit. 2025 is provisional.Chart: Oakland Accident Care · oaklandaccidentcare.com · CC BY 4.0
Download PNG (1200px) · SVG · Data: intl-by-quarter.csv
Show the numbers
Table 3. Injury or fatal crashes on International Blvd (14th–107th Ave) by quarter
YearQ1Q2Q3Q4
202136495653
202253494547
202345615054
202428474541
202532352832
Embed this chart

Copy this HTML. It shows the PNG and links back to this page, as the CC BY 4.0 license asks.

<figure style="margin:0;max-width:760px"><a href="https://oaklandaccidentcare.com/oakland-crash-data/international-blvd#intl-quarters"><img src="https://oaklandaccidentcare.com/data/oakland-crashes/charts/intl-quarters.png" alt="Line chart of injury or fatal crashes per quarter on International Blvd, 14th to 107th Ave, 2021 to 2025. Quarters ran between 36 and 61 in 2021–2023, dropped to 28 in early 2024, and were between 28 and 35 in each quarter of 2025. The construction period, July to October 2024, is shaded." width="1200" style="width:100%;height:auto"></a><figcaption style="font-size:13px">Source: Oakland Accident Care analysis of California Highway Patrol CCRS crash records (CC BY 4.0). <a href="https://oaklandaccidentcare.com/oakland-crash-data/international-blvd">International Blvd logged about a third fewer injury crashes in the year after its quick-build. The rest of Oakland held steady.</a></figcaption></figure>
Change in injury crashes, 2021–2023 average to 2025, on Oakland’s busiest streetsHorizontal bar chart of the change in injury crashes from the 2021–2023 average to 2025 on the 17 Oakland streets with the most injury crashes, each counted along its whole length. International Blvd -30%; Foothill Blvd -24%; Bancroft Ave -7%; MacArthur Blvd +10%; 98th Ave +6%; San Leandro St +29%; High St -10%; Martin Luther King Jr Way +14%; Broadway +15%; 14th St -10%; Telegraph Ave -31%; Market St -17%; 7th St -26%; 73rd Ave -14%; Seminary Ave -37%; Fruitvale Ave -12%; W Grand Ave -7%.Change in injury crashes, 2021–2023 average to 2025, onOakland’s busiest streetsWhole length of each street in Oakland; the 17 streets with the most injury crashes in 2021–2023Other busy streetsInternational Blvd (whole street)−60%−40%−20%0%+20%+40%International Blvd: −30%International Blvd−30%Foothill Blvd: −24%Foothill Blvd−24%Bancroft Ave: −7%Bancroft Ave−7%MacArthur Blvd: +10%MacArthur Blvd+10%98th Ave: +6%98th Ave+6%San Leandro St: +29%San Leandro St+29%High St: −10%High St−10%Martin Luther King Jr Way: +14%Martin Luther King Jr Way+14%Broadway: +15%Broadway+15%14th St: −10%14th St−10%Telegraph Ave: −31%Telegraph Ave−31%Market St: −17%Market St−17%7th St: −26%7th St−26%73rd Ave: −14%73rd Ave−14%Seminary Ave: −37%Seminary Ave−37%Fruitvale Ave: −12%Fruitvale Ave−12%W Grand Ave: −7%W Grand Ave−7%Source: Oakland Accident Care count of CHP CCRS crash records, downloaded October 26, 2026. Constructiondates: AC Transit. 2025 is provisional.Chart: Oakland Accident Care · oaklandaccidentcare.com · CC BY 4.0
Download PNG (1200px) · SVG · Data: intl-peer-streets.csv
Show the numbers
Table 4. Injury or fatal crashes on the 17 busiest streets, whole length
Street (whole length)202120222023202420252021–2023 averageChange to 2025
International Blvd210206225180149213.7−30.3%
Foothill Blvd1107475706686.3−23.6%
Bancroft Ave747975777176.0−6.6%
MacArthur Blvd717460587568.3+9.8%
98th Ave506860436359.3+6.2%
San Leandro St355952486348.7+29.5%
High St365645434145.7−10.2%
Martin Luther King Jr Way404153485144.7+14.2%
Broadway385441485144.3+15.0%
14th St394335393539.0−10.3%
Telegraph Ave393935312637.7−31.0%
Market St295132373137.3−17.0%
7th St264633212635.0−25.7%
73rd Ave363732283035.0−14.3%
Seminary Ave342536232031.7−36.8%
Fruitvale Ave323627202831.7−11.6%
W Grand Ave283234232931.3−7.4%
Embed this chart

Copy this HTML. It shows the PNG and links back to this page, as the CC BY 4.0 license asks.

<figure style="margin:0;max-width:760px"><a href="https://oaklandaccidentcare.com/oakland-crash-data/international-blvd#intl-peers"><img src="https://oaklandaccidentcare.com/data/oakland-crashes/charts/intl-peers.png" alt="Horizontal bar chart of the change in injury crashes from the 2021–2023 average to 2025 on the 17 Oakland streets with the most injury crashes, each counted along its whole length. International Blvd -30%; Foothill Blvd -24%; Bancroft Ave -7%; MacArthur Blvd +10%; 98th Ave +6%; San Leandro St +29%; High St -10%; Martin Luther King Jr Way +14%; Broadway +15%; 14th St -10%; Telegraph Ave -31%; Market St -17%; 7th St -26%; 73rd Ave -14%; Seminary Ave -37%; Fruitvale Ave -12%; W Grand Ave -7%." width="1200" style="width:100%;height:auto"></a><figcaption style="font-size:13px">Source: Oakland Accident Care analysis of California Highway Patrol CCRS crash records (CC BY 4.0). <a href="https://oaklandaccidentcare.com/oakland-crash-data/international-blvd">International Blvd logged about a third fewer injury crashes in the year after its quick-build. The rest of Oakland held steady.</a></figcaption></figure>

More tables

Table 2. Before and after construction, by month (July–October 2024 left out)
WindowMonthsInternational Blvd crashesPer monthRest of Oakland crashesPer month
Before: Jan 2021 – Jun 20244267316.04,638110.4
After: Nov 2024 – Dec 20251415210.91,549110.6
Change per month−32.2%+0.2%
Table 5. International Blvd (14th–107th Ave) by council district section
Section (council district)20212022202320242025
District 22427272517
District 54748695236
District 67871753738
District 74548394736

What this data can’t tell you

  • Why the count fell. The quick-build is one change among several on and around the corridor: traffic volumes, enforcement and other street work also changed over these years, and the state records hold none of that.
  • Whether the drop will last. 2025 is one year, and it is provisional: late reports can still be added. 2026 so far looks similar (8.9% of Oakland’s injury crashes, against 8.7% in 2025 and 12.9% in 2021–2023), but 2026 reports are far from complete. A speed camera on International Blvd between 40th and 41st Avenue began ticketing in March 2026.
  • Exactly when it started. The first quarter of 2024, before any construction, was already lower than any quarter of 2021–2023 (28 crashes, against 36 to 61; Table 3).
  • Rates. These are counts. The state records have no traffic volumes, so we cannot say whether fewer people drove the corridor.
  • Deaths. Fatal crashes on the corridor are too few for a before-and-after comparison (fewer than five in every year from 2021 to 2025 except 2023, in these records). For deaths, use the City’s tracker.[7]
  • Crashes nobody reported to police are not in these records.

Methods

  • Corridor. Crashes whose report names International Blvd (or its old name, East 14th Street) and a cross street that meets International Blvd between 14th Avenue and 107th Avenue, the quick-build’s limits, at any distance from that cross street.[1][2][4]
  • Dates. AC Transit announced the project on April 10, 2024, scheduled the first work for July 22, 2024, and says construction was complete as of October 2024.[4][5][6] AC Transit service alerts in March 2025 still listed project work at stations between 67th and 73rd Avenue. We compare 2021–2023 with 2025, and, as a check, January 2021–June 2024 with November 2024–December 2025 by month. July–October 2024 is left out.
  • Control. Every other injury or fatal crash on Oakland’s city streets over the same years. Freeway crashes are left out of both.
  • Chance. Relative to the rest of Oakland, the corridor’s 2025 count was 0.64 times what its 2021–2023 average would predict (95% interval 0.53 to 0.79, treating counts as Poisson). The interval covers chance variation only, not other differences between streets.
  • A check on the data. If reports had started naming the street differently, those crashes could not be placed and the count would drop for that reason alone. Every year from 2021 to 2025, at least 98.5% of crash reports naming International Blvd or East 14th Street were placed at a cross street, and those reports also fell, from 540 in 2023 to 355 in 2025 (all severities).
  • Peer streets. The 16 streets with the most injury crashes in 2021–2023 after International Blvd, chosen by that rule so no street is hand-picked. Each is counted along its whole length in Oakland, and so is International Blvd in that table.

The full method for every table is in methods.txt.

Download the data (CSV)

One file per table. Counts from 1 to 4 are written “<5”. The script that builds every table is tools/crash-analysis.py; it downloads the same public files.

How to cite

Oakland Accident Care, “International Blvd logged about a third fewer injury crashes in the year after its quick-build. The rest of Oakland held steady.” November 1, 2026, https://oaklandaccidentcare.com/oakland-crash-data/international-blvd. Data: California Highway Patrol, California Crash Reporting System (CCRS), California Open Data Portal, downloaded October 26, 2026.

Our tables, CSV files and charts are under Creative Commons Attribution 4.0 (CC BY 4.0): reuse them, including commercially, with credit to Oakland Accident Care and a link to this page. The underlying CCRS records are public domain.

Sources

  1. California Highway Patrol, California Crash Reporting System (CCRS), California Open Data Portal. Crashes, Parties and InjuredWitnessPassengers files, 2021–2026, downloaded October 26, 2026. https://data.ca.gov/dataset/ccrs
  2. City of Oakland, "OaklandStreets" street centerlines, used to place each crash at the intersection named on the report. https://gismaps.oaklandca.gov/server/rest/services/OaklandStreets/FeatureServer/0
  3. City of Oakland (OaklandGIS), "Council District 2022 Revised," adopted February 23, 2022. https://www.arcgis.com/home/item.html?id=b7e06c587b544d8187fe7a0d508f2078
  4. AC Transit, "AC Transit & City of Oakland to roll out International Boulevard Quick Build," press release, April 10, 2024. https://www.actransit.org/press-release/ac-transit-city-of-oakland-launch-international-boulevard-quick-build
  5. AC Transit, service alert of July 19, 2024: quick-build work scheduled from July 22 between 14th Ave. and 107th Ave. https://www.actransit.org/node/21058
  6. AC Transit, "Quick Build International Blvd." project page (undated; read October 26, 2026): "As of October 2024, construction ... has been completed." https://actransit.org/quick-builds/international-qb
  7. City of Oakland, "Monitoring Traffic Deaths in Oakland" (map layers for 2025 and 2026, "Updated 10/21/2026"), read October 26, 2026. https://www.oaklandca.gov/Public-Safety-Streets/Traffic-Safety/Safe-Oakland-Streets/Monitoring-Traffic-Deaths-in-Oakland