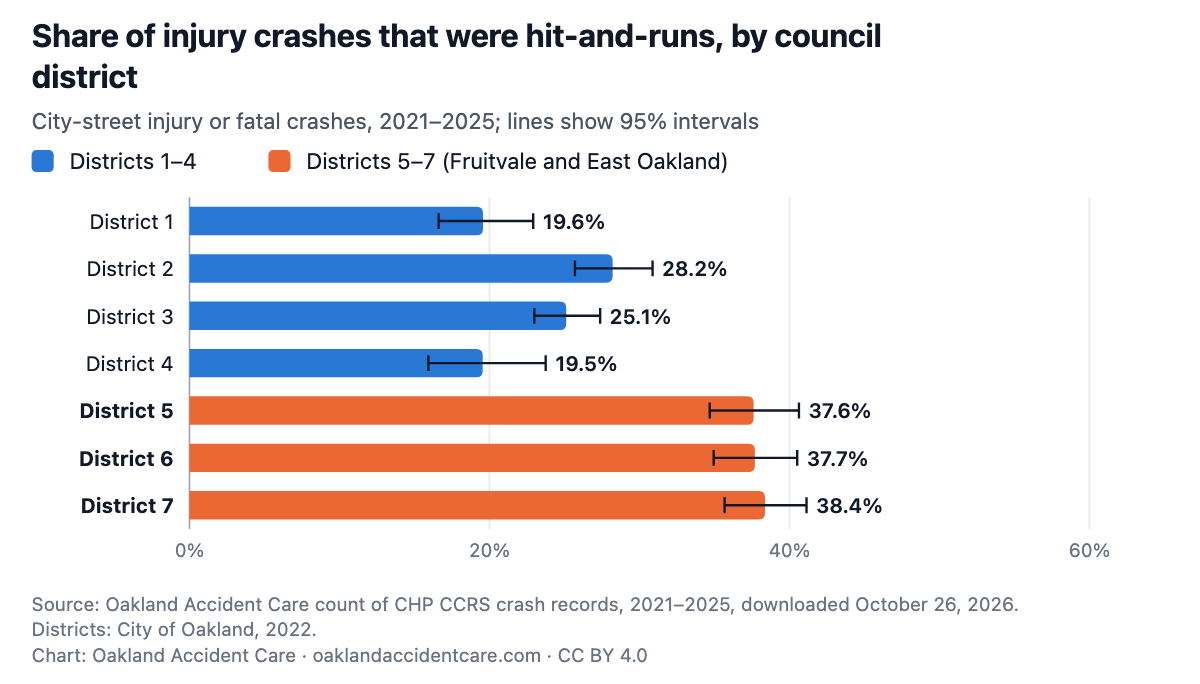
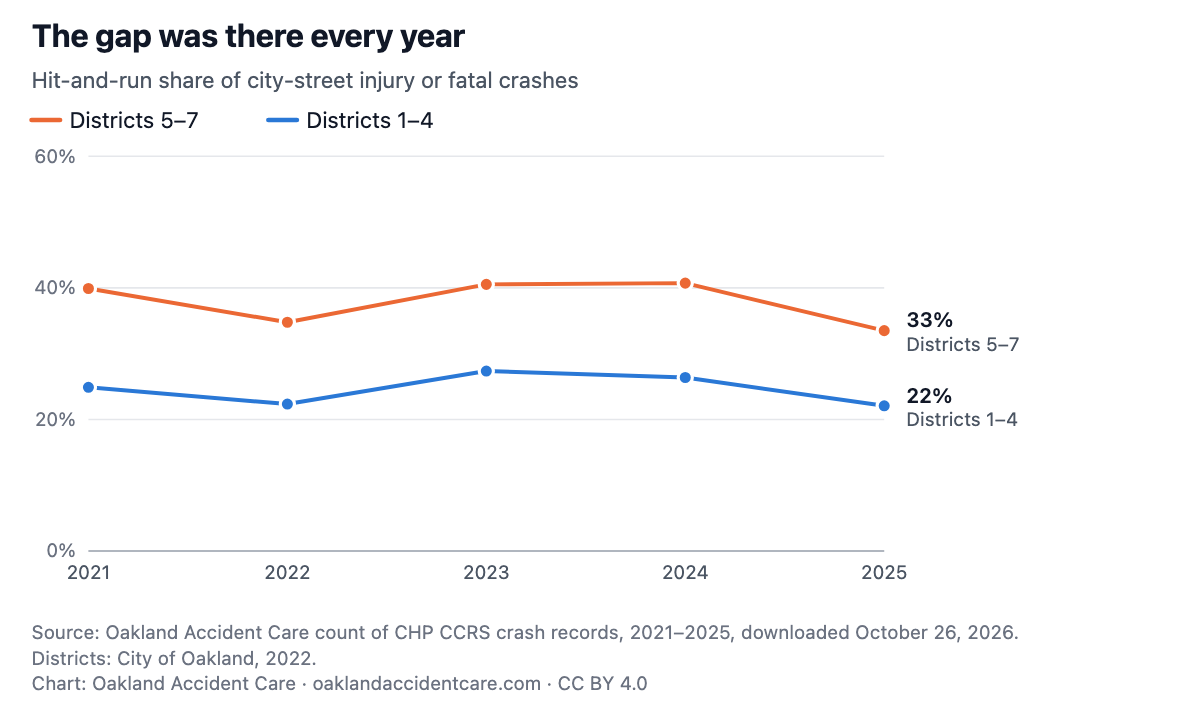
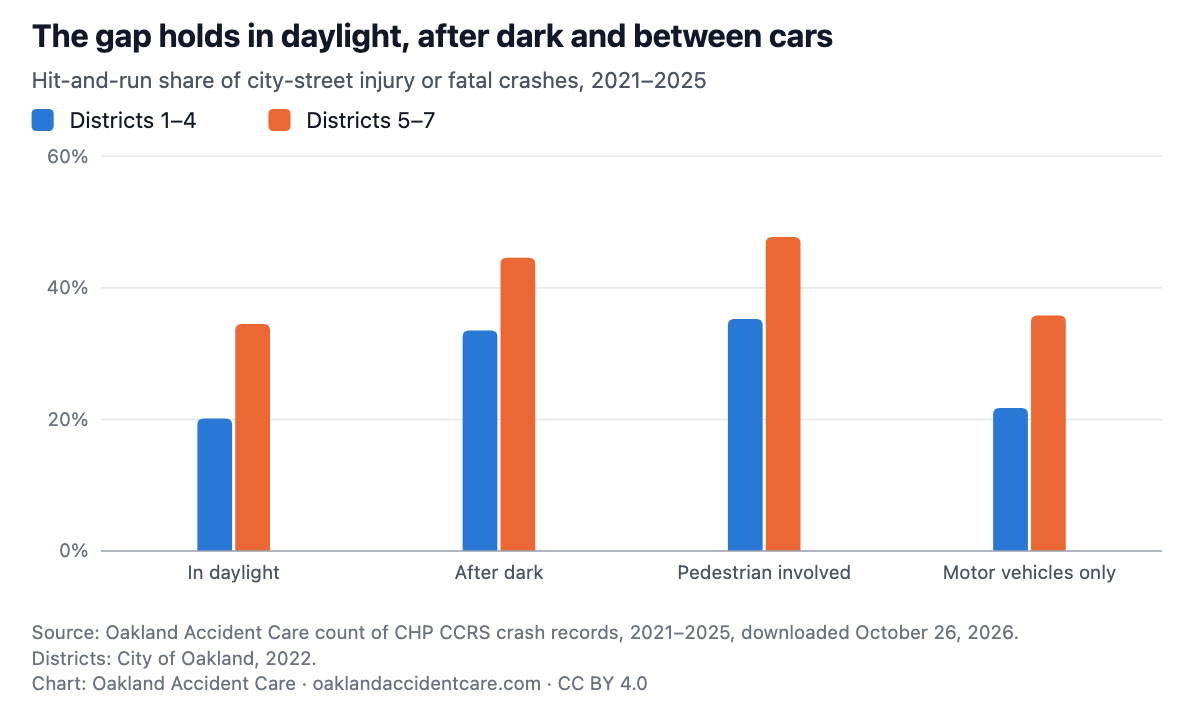
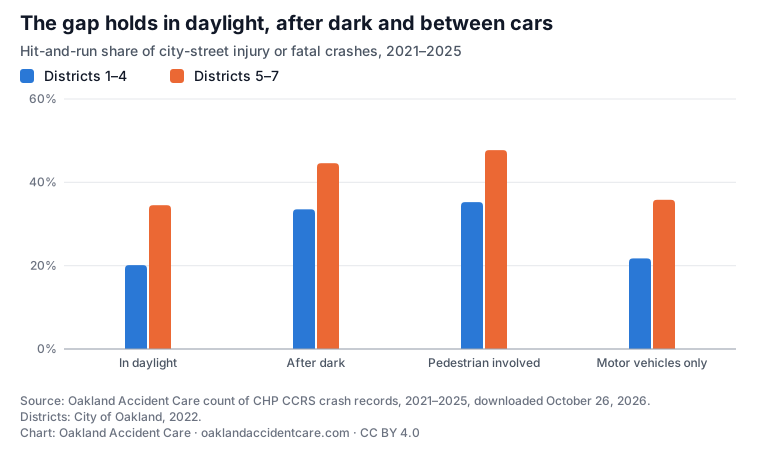
From 2021 through 2025, 37.6% to 38.4% of injury or fatal crashes on city streets in Council Districts 5, 6 and 7 were hit-and-runs, against 19.5% and 19.6% in Districts 4 and 1. The gap was there every year, in daylight and after dark.
Analysis by Oakland Accident Care, a chiropractic clinic in downtown Oakland.
| Council district | Injury or fatal crashes | Hit-and-run | Share | 95% interval | Felony hit-and-run only | Involving a pedestrian | Hit-and-run | Share | 95% interval |
|---|---|---|---|---|---|---|---|---|---|
| District 1 | 608 | 119 | 19.6% | 16.6–22.9% | 5.4% | 103 | 27 | 26.2% | 18.7–35.5% |
| District 2 | 1,159 | 327 | 28.2% | 25.7–30.9% | 7.5% | 207 | 75 | 36.2% | 30.0–43.0% |
| District 3 | 1,497 | 376 | 25.1% | 23.0–27.4% | 7.8% | 227 | 93 | 41.0% | 34.8–47.5% |
| District 4 | 394 | 77 | 19.5% | 15.9–23.7% | 5.3% | 56 | 14 | 25.0% | 15.5–37.7% |
| District 5 | 1,013 | 381 | 37.6% | 34.7–40.6% | 9.7% | 166 | 74 | 44.6% | 37.2–52.2% |
| District 6 | 1,162 | 438 | 37.7% | 35.0–40.5% | 10.1% | 154 | 77 | 50.0% | 42.2–57.8% |
| District 7 | 1,212 | 465 | 38.4% | 35.7–41.1% | 10.1% | 145 | 71 | 49.0% | 41.0–57.0% |
| Could not be placed | 489 | 127 | 26.0% | 22.3–30.0% | 7.6% | 77 | 34 | 44.2% | 33.6–55.3% |
Copy this HTML. It shows the PNG and links back to this page, as the CC BY 4.0 license asks.
<figure style="margin:0;max-width:760px"><a href="https://oaklandaccidentcare.com/oakland-crash-data/hit-and-run#hr-district"><img src="https://oaklandaccidentcare.com/data/oakland-crashes/charts/hr-district.png" alt="Horizontal bar chart of the share of city-street injury or fatal crashes that were hit-and-runs, 2021–2025, by council district, with 95% intervals. District 1 19.6%; District 2 28.2%; District 3 25.1%; District 4 19.5%; District 5 37.6%; District 6 37.7%; District 7 38.4%." width="1200" style="width:100%;height:auto"></a><figcaption style="font-size:13px">Source: Oakland Accident Care analysis of California Highway Patrol CCRS crash records (CC BY 4.0). <a href="https://oaklandaccidentcare.com/oakland-crash-data/hit-and-run">In Oakland’s Council Districts 5, 6 and 7, more than a third of injury crashes are hit-and-runs. In the rest of the city, about one in four are.</a></figcaption></figure>| Year | Districts 5–7: crashes | Hit-and-run share | Districts 1–4: crashes | Hit-and-run share |
|---|---|---|---|---|
| 2021 | 704 | 39.9% | 679 | 24.9% |
| 2022 | 736 | 34.8% | 788 | 22.3% |
| 2023 | 730 | 40.5% | 724 | 27.3% |
| 2024 | 599 | 40.7% | 747 | 26.4% |
| 2025 (provisional) | 618 | 33.5% | 720 | 22.1% |
Copy this HTML. It shows the PNG and links back to this page, as the CC BY 4.0 license asks.
<figure style="margin:0;max-width:760px"><a href="https://oaklandaccidentcare.com/oakland-crash-data/hit-and-run#hr-year"><img src="https://oaklandaccidentcare.com/data/oakland-crashes/charts/hr-year.png" alt="Line chart of hit-and-run share by year, 2021–2025: Districts 5–7 39.9%, 34.8%, 40.5%, 40.7%, 33.5%; Districts 1–4 24.9%, 22.3%, 27.3%, 26.4%, 22.1%." width="1200" style="width:100%;height:auto"></a><figcaption style="font-size:13px">Source: Oakland Accident Care analysis of California Highway Patrol CCRS crash records (CC BY 4.0). <a href="https://oaklandaccidentcare.com/oakland-crash-data/hit-and-run">In Oakland’s Council Districts 5, 6 and 7, more than a third of injury crashes are hit-and-runs. In the rest of the city, about one in four are.</a></figcaption></figure>| Group | Districts 5–7: crashes | Hit-and-run | Share | Districts 1–4: crashes | Hit-and-run | Share |
|---|---|---|---|---|---|---|
| In daylight | 2,063 | 712 | 34.5% | 2,374 | 478 | 20.1% |
| After dark | 1,135 | 506 | 44.6% | 1,077 | 361 | 33.5% |
| Involving a pedestrian | 465 | 222 | 47.7% | 593 | 209 | 35.2% |
| Involving a bicyclist | 179 | 89 | 49.7% | 377 | 95 | 25.2% |
| Involving a motorcycle | 214 | 68 | 31.8% | 222 | 59 | 26.6% |
| Motor vehicles only | 2,539 | 909 | 35.8% | 2,478 | 539 | 21.8% |
| With a death or serious injury | 277 | 129 | 46.6% | 249 | 83 | 33.3% |
Copy this HTML. It shows the PNG and links back to this page, as the CC BY 4.0 license asks.
<figure style="margin:0;max-width:760px"><a href="https://oaklandaccidentcare.com/oakland-crash-data/hit-and-run#hr-cuts"><img src="https://oaklandaccidentcare.com/data/oakland-crashes/charts/hr-cuts.png" alt="Grouped column chart of hit-and-run share, Districts 5–7 against Districts 1–4: In daylight 34.5% against 20.1%; After dark 44.6% against 33.5%; Involving a pedestrian 47.7% against 35.2%; Motor vehicles only 35.8% against 21.8%." width="1200" style="width:100%;height:auto"></a><figcaption style="font-size:13px">Source: Oakland Accident Care analysis of California Highway Patrol CCRS crash records (CC BY 4.0). <a href="https://oaklandaccidentcare.com/oakland-crash-data/hit-and-run">In Oakland’s Council Districts 5, 6 and 7, more than a third of injury crashes are hit-and-runs. In the rest of the city, about one in four are.</a></figcaption></figure>The full method for every table is in methods.txt.
One file per table. Counts from 1 to 4 are written “<5”. The script that builds every table is tools/crash-analysis.py; it downloads the same public files.
Oakland Accident Care, “In Oakland’s Council Districts 5, 6 and 7, more than a third of injury crashes are hit-and-runs. In the rest of the city, about one in four are.” November 1, 2026, https://oaklandaccidentcare.com/oakland-crash-data/hit-and-run. Data: California Highway Patrol, California Crash Reporting System (CCRS), California Open Data Portal, downloaded October 26, 2026.
Our tables, CSV files and charts are under Creative Commons Attribution 4.0 (CC BY 4.0): reuse them, including commercially, with credit to Oakland Accident Care and a link to this page. The underlying CCRS records are public domain.
Oakland Accident Care · 435 8th Street, Suite 203, Oakland, CA 94607
(510) 606-0007 · oaklandaccidentcare@gmail.com
Call to schedule
Same-day appointments · Appointments · Services · Why choose us · Reviews · Blog
Oakland Accident Care is a service of Glass Velichko Chiropractic P.C. © 2026 · Privacy · Terms · For attorneys
This site is general information, not medical or legal advice. If you are having a medical emergency, call 911.