Oakland crash data · Our analysis

Oakland’s 18 speed-camera blocks logged about 19 injury crashes a year before the cameras: too few to measure a change yet.

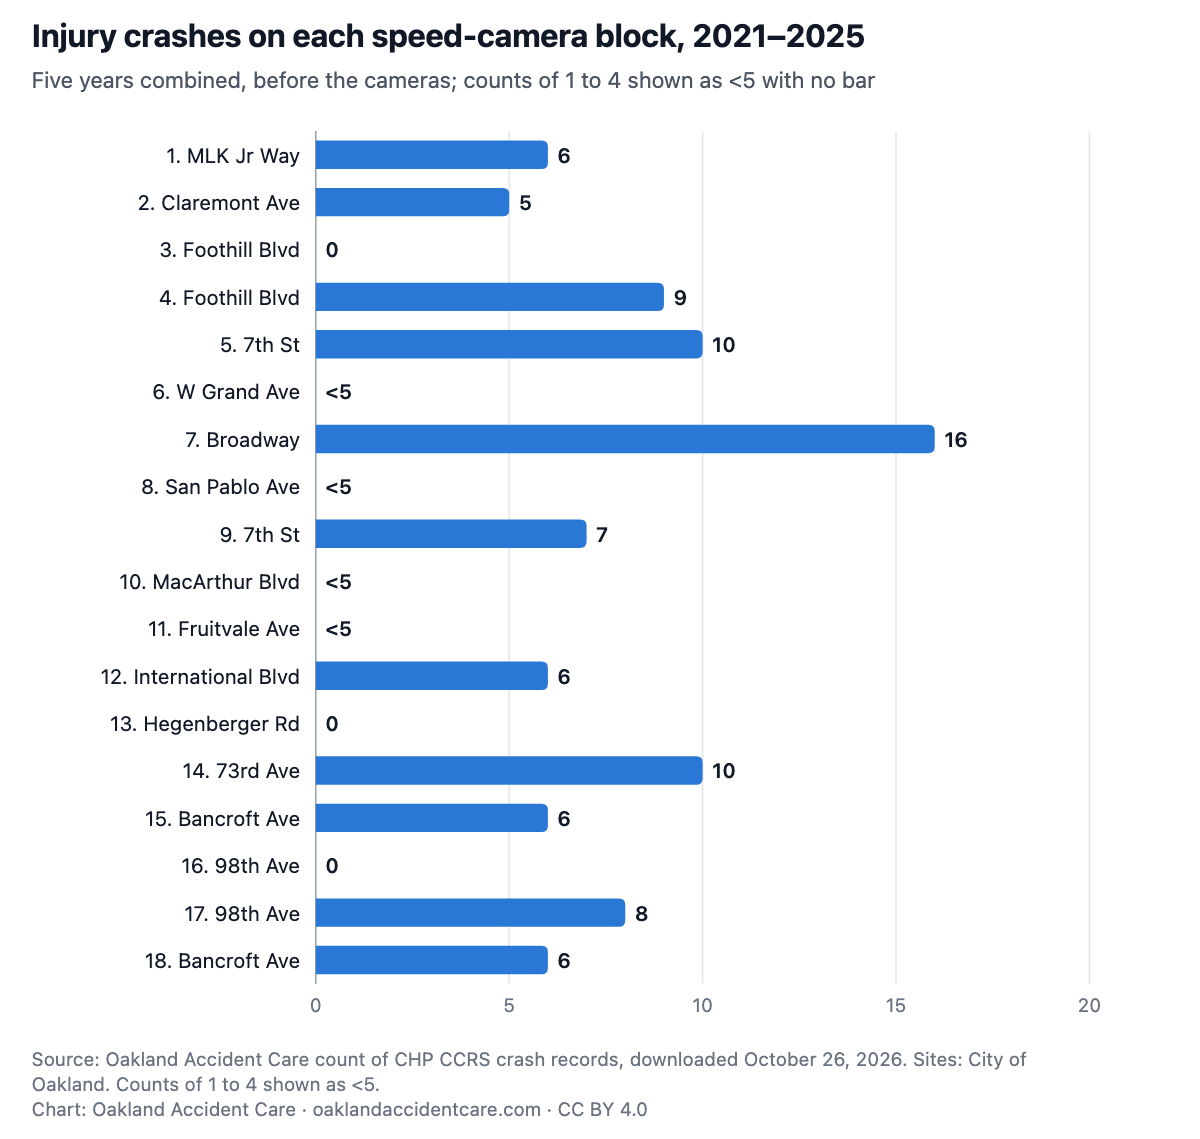
Police reported 97 injury or fatal crashes on the 18 camera blocks from 2021 through 2025. No single block had more than 16. The cameras began ticketing on March 15, 2026, and state records for 2026 are still far from complete.

Analysis by Oakland Accident Care, a chiropractic clinic in downtown Oakland.

Published November 1, 2026 · State crash records downloaded October 26, 2026 · 2025 provisional, 2026 partial (crashes through 2026-10-23)

Key findings

  1. From 2021 through 2025, police reported 97 injury or fatal crashes on the 18 blocks where Oakland put speed cameras: about 19 a year across all 18 together (19, 22, 20, 22, 14 by year). Table 1[1][4]
  2. Broadway between 26th and 27th Street had the most, 16 in five years. Three blocks had no injury crash in these records. Table 1[1]
  3. At about 19 crashes a year, chance alone can put a single year’s count roughly 9 above or below its usual level, so one year of camera data could not show a smaller change. Table 1[1]
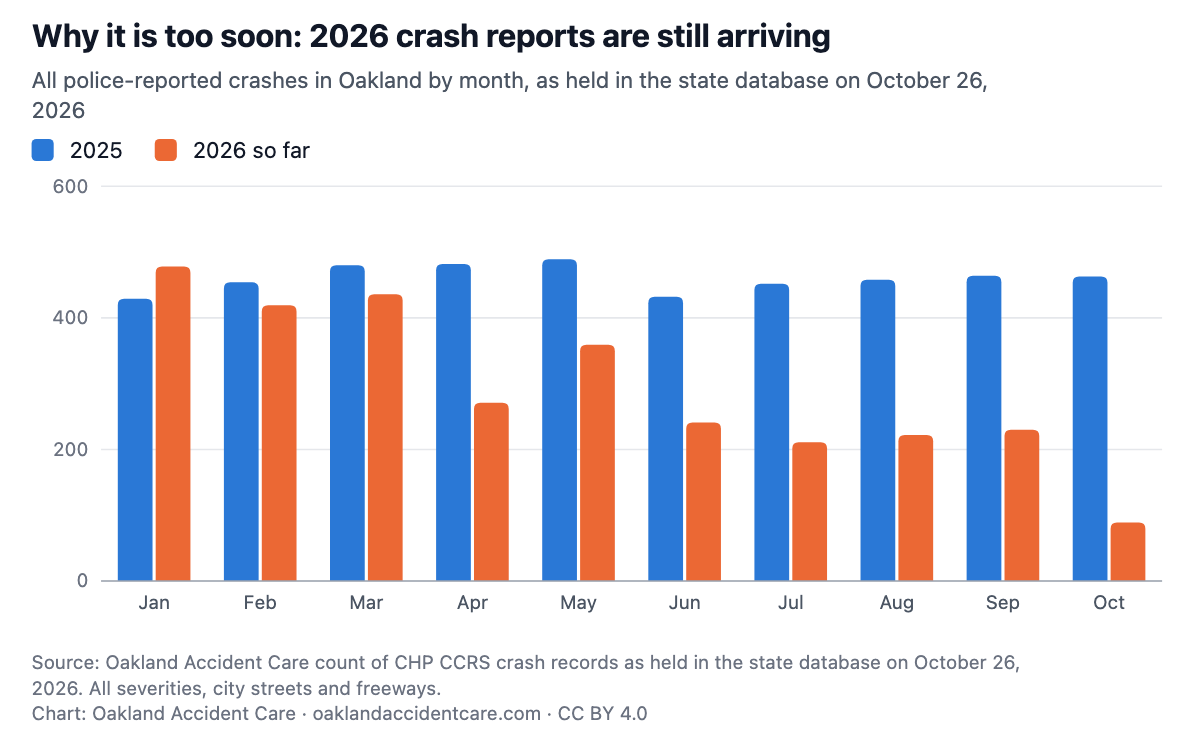
  4. Reports arrive late. As of October 26, 2026, the state database held 47% to 73% as many crashes for each month from April to September 2026 as for the same month of 2025. Table 2[1][6]
  5. The City’s six-month report gives speeds and violations, not crashes: it reports about 70% fewer vehicles going 11 mph or more over the limit.[5]

Charts and the tables behind them

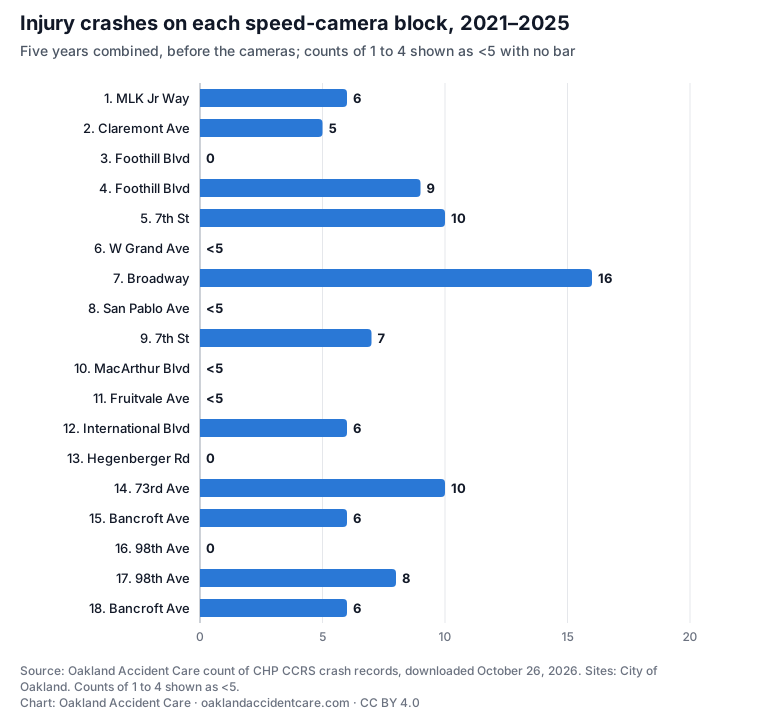
Injury crashes on each speed-camera block, 2021–2025Horizontal bar chart of injury or fatal crashes at each of the 18 speed-camera blocks, 2021–2025: 1. Martin Luther King Jr Way, 42nd St–43rd St: 6; 2. Claremont Ave, Hillegass Ave–College Ave: 5; 3. Foothill Blvd, Irving Ave–24th Ave: 0; 4. Foothill Blvd, 19th Ave–20th Ave: 9; 5. 7th St, Adeline St–Linden St: 10; 6. W Grand Ave, Chestnut St–Linden St: <5; 7. Broadway, 26th St–27th St: 16; 8. San Pablo Ave, Athens Ave–Sycamore St: <5; 9. 7th St, Broadway–Franklin St: 7; 10. MacArthur Blvd, Green Acre Rd–Enos Ave: <5; 11. Fruitvale Ave, Galindo St–Logan St: <5; 12. International Blvd, 40th Ave–41st Ave: 6; 13. Hegenberger Rd, Spencer St–Hawley St: 0; 14. 73rd Ave, Fresno St–Krause Ave: 10; 15. Bancroft Ave, 86th Ave–Auseon Ave: 6; 16. 98th Ave, Blake Dr–Gould St: 0; 17. 98th Ave, Cherry St–Birch St: 8; 18. Bancroft Ave, 61st Ave–62nd Ave: 6. Counts from 1 to 4 are shown as less than 5, without a bar.Injury crashes on each speed-camera block, 2021–2025Five years combined, before the cameras; counts of 1 to 4 shown as <5 with no bar051015201. MLK Jr Way: 61. MLK Jr Way62. Claremont Ave: 52. Claremont Ave53. Foothill Blvd: 03. Foothill Blvd04. Foothill Blvd: 94. Foothill Blvd95. 7th St: 105. 7th St106. W Grand Ave: <56. W Grand Ave<57. Broadway: 167. Broadway168. San Pablo Ave: <58. San Pablo Ave<59. 7th St: 79. 7th St710. MacArthur Blvd: <510. MacArthur Blvd<511. Fruitvale Ave: <511. Fruitvale Ave<512. International Blvd: 612. International Blvd613. Hegenberger Rd: 013. Hegenberger Rd014. 73rd Ave: 1014. 73rd Ave1015. Bancroft Ave: 615. Bancroft Ave616. 98th Ave: 016. 98th Ave017. 98th Ave: 817. 98th Ave818. Bancroft Ave: 618. Bancroft Ave6Source: Oakland Accident Care count of CHP CCRS crash records, downloaded October 26, 2026. Sites: City ofOakland. Counts of 1 to 4 shown as <5.Chart: Oakland Accident Care · oaklandaccidentcare.com · CC BY 4.0
Download PNG (1200px) · SVG · Data: camera-sites-injury-crashes.csv
Show the numbers
Table 1. Injury or fatal crashes on the 18 speed-camera blocks, 2021–2025 (2025 provisional)
SiteStreetBetween20212022202320242025TotalPedestrian involvedFatal or serious injury
1Martin Luther King Jr Way42nd St–43rd St0<5<5<506<5<5
2Claremont AveHillegass Ave–College Ave<5<50<505<5<5
3Foothill BlvdIrving St–24th Ave (Irving Ave)00000000
4Foothill Blvd19th Ave–20th Ave<50<5<5<59<50
57th StAdeline St–Linden St<5<5<5<5<510<5<5
6W Grand AveChestnut St–Linden St00<500<5<50
7Broadway26th St–27th St<5<5<5<5516<50
8San Pablo AveAthens Ave–Sycamore St<500<50<500
97th StBroadway–Franklin St<5<5<50<570<5
10MacArthur BlvdGreen Acre Rd–Enos Ave00<500<500
11Fruitvale AveGalindo St–Logan St<50<5<50<5<50
12International Blvd40th Ave–41st Ave0<5<5<50600
13Hegenberger RdSpencer St–Hawley St00000000
1473rd AveFresno St–Krause Ave0<5<5<5<5100<5
15Bancroft Ave86th Ave–Auseon Ave<5<5<5<506<50
1698th AveBlake Dr–Gould St00000000
1798th AveCherry St–Birch St<5<5<5<5<58<50
18Bancroft Ave61st Ave–62nd Ave<5<5<5006<5<5
All 18 sites192220221497177
Embed this chart

Copy this HTML. It shows the PNG and links back to this page, as the CC BY 4.0 license asks.

<figure style="margin:0;max-width:760px"><a href="https://oaklandaccidentcare.com/oakland-crash-data/speed-camera-sites#cam-sites"><img src="https://oaklandaccidentcare.com/data/oakland-crashes/charts/cam-sites.png" alt="Horizontal bar chart of injury or fatal crashes at each of the 18 speed-camera blocks, 2021–2025: 1. Martin Luther King Jr Way, 42nd St–43rd St: 6; 2. Claremont Ave, Hillegass Ave–College Ave: 5; 3. Foothill Blvd, Irving Ave–24th Ave: 0; 4. Foothill Blvd, 19th Ave–20th Ave: 9; 5. 7th St, Adeline St–Linden St: 10; 6. W Grand Ave, Chestnut St–Linden St: &lt;5; 7. Broadway, 26th St–27th St: 16; 8. San Pablo Ave, Athens Ave–Sycamore St: &lt;5; 9. 7th St, Broadway–Franklin St: 7; 10. MacArthur Blvd, Green Acre Rd–Enos Ave: &lt;5; 11. Fruitvale Ave, Galindo St–Logan St: &lt;5; 12. International Blvd, 40th Ave–41st Ave: 6; 13. Hegenberger Rd, Spencer St–Hawley St: 0; 14. 73rd Ave, Fresno St–Krause Ave: 10; 15. Bancroft Ave, 86th Ave–Auseon Ave: 6; 16. 98th Ave, Blake Dr–Gould St: 0; 17. 98th Ave, Cherry St–Birch St: 8; 18. Bancroft Ave, 61st Ave–62nd Ave: 6. Counts from 1 to 4 are shown as less than 5, without a bar." width="1200" style="width:100%;height:auto"></a><figcaption style="font-size:13px">Source: Oakland Accident Care analysis of California Highway Patrol CCRS crash records (CC BY 4.0). <a href="https://oaklandaccidentcare.com/oakland-crash-data/speed-camera-sites">Oakland’s 18 speed-camera blocks logged about 19 injury crashes a year before the cameras: too few to measure a change yet.</a></figcaption></figure>
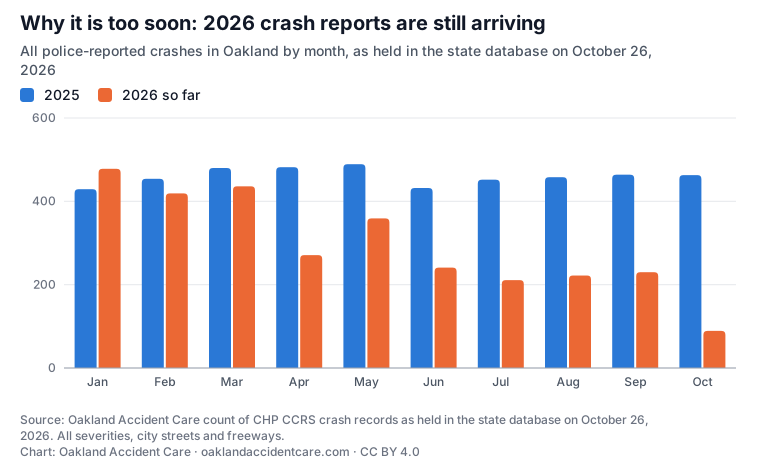
Why it is too soon: 2026 crash reports are still arrivingGrouped column chart of all police-reported crashes in Oakland by month, 2025 against 2026, as held in the state database on October 26, 2026: Jan 429 and 478; Feb 454 and 419; Mar 480 and 436; Apr 482 and 271; May 489 and 359; Jun 432 and 241; Jul 452 and 211; Aug 458 and 222; Sep 464 and 230; Oct 463 and 89. 2026 months after March hold about half as many as 2025.Why it is too soon: 2026 crash reports are still arrivingAll police-reported crashes in Oakland by month, as held in the state database on October 26,202620252026 so far0200400600Jan, 2025: 429Jan, 2026 so far: 478JanFeb, 2025: 454Feb, 2026 so far: 419FebMar, 2025: 480Mar, 2026 so far: 436MarApr, 2025: 482Apr, 2026 so far: 271AprMay, 2025: 489May, 2026 so far: 359MayJun, 2025: 432Jun, 2026 so far: 241JunJul, 2025: 452Jul, 2026 so far: 211JulAug, 2025: 458Aug, 2026 so far: 222AugSep, 2025: 464Sep, 2026 so far: 230SepOct, 2025: 463Oct, 2026 so far: 89OctSource: Oakland Accident Care count of CHP CCRS crash records as held in the state database on October 26,2026. All severities, city streets and freeways.Chart: Oakland Accident Care · oaklandaccidentcare.com · CC BY 4.0
Download PNG (1200px) · SVG · Data: reporting-lag-by-month.csv
Show the numbers
Table 2. Police-reported crashes in Oakland by month (all severities, city streets and freeways), as held in CCRS on October 26, 2026
MonthAll crashes, 2025All crashes, 2026 so far2026 as a share of 2025
Jan429478111.4%
Feb45441992.3%
Mar48043690.8%
Apr48227156.2%
May48935973.4%
Jun43224155.8%
Jul45221146.7%
Aug45822248.5%
Sep46423049.6%
Oct4638919.2%
Embed this chart

Copy this HTML. It shows the PNG and links back to this page, as the CC BY 4.0 license asks.

<figure style="margin:0;max-width:760px"><a href="https://oaklandaccidentcare.com/oakland-crash-data/speed-camera-sites#cam-lag"><img src="https://oaklandaccidentcare.com/data/oakland-crashes/charts/cam-lag.png" alt="Grouped column chart of all police-reported crashes in Oakland by month, 2025 against 2026, as held in the state database on October 26, 2026: Jan 429 and 478; Feb 454 and 419; Mar 480 and 436; Apr 482 and 271; May 489 and 359; Jun 432 and 241; Jul 452 and 211; Aug 458 and 222; Sep 464 and 230; Oct 463 and 89. 2026 months after March hold about half as many as 2025." width="1200" style="width:100%;height:auto"></a><figcaption style="font-size:13px">Source: Oakland Accident Care analysis of California Highway Patrol CCRS crash records (CC BY 4.0). <a href="https://oaklandaccidentcare.com/oakland-crash-data/speed-camera-sites">Oakland’s 18 speed-camera blocks logged about 19 injury crashes a year before the cameras: too few to measure a change yet.</a></figcaption></figure>

What this data can’t tell you

  • Whether the cameras changed crash numbers. This page is a baseline only. A fair comparison needs at least a full year of ticketing (which ends March 2027) and enough time for those reports to reach the state database; UC Berkeley’s TIMS says CHP data entry typically lags 12 to 18 months.[6]
  • A clean before-and-after, even later. The City chose these blocks because they had speeding problems. Places picked for a bad stretch often improve somewhat on their own, so a later drop would not be all down to the cameras.
  • Every crash on each block. A crash is counted only when the report names one of the block’s two cross streets and puts it within 250 feet of it. Officers sometimes measure from a bigger cross street. No report in these years paired Hegenberger Rd with Spencer St or Hawley St, so that block shows no crash of any severity, which likely undercounts it. Foothill Blvd (24th Ave–Irving Ave) and 98th Ave (Blake Dr–Gould St) had crashes reported at their corners, but none with an injury.
  • The direction from the cross street is not used, so a few crashes just outside a block can be included.
  • International Blvd between 40th and 41st Avenue is also inside the 2024 quick-build corridor, so its numbers mix two changes.
  • Crashes nobody reported to police are not in these records.

Methods

  • Sites. The 18 sites as the City lists them on its program page.[4] The City writes site 3 as “Irving St”; Oakland’s street file has only Irving Ave, which meets Foothill Blvd next to 24th Avenue, so we used Irving Ave.[2]
  • Crashes. Injury or fatal crashes on the camera street (the road the report lists first) at or within 250 feet of either cross street that bounds the camera block, plus crashes at those corners, 2021–2025. Crashes on the cross streets are not counted.[1]
  • Dates. The cameras went live on January 14, 2026, with warnings through March 14; tickets began March 15, 2026.[5]
  • Chance. “Roughly 9 either way” is 1.96 times the square root of the yearly average (19.4), the usual 95% range for a count that varies by chance.
  • Lag table. All police-reported crashes in Oakland, any severity, by month of the crash, as held in the state files downloaded October 26, 2026.

The full method for every table is in methods.txt.

Download the data (CSV)

One file per table. Counts from 1 to 4 are written “<5”. The script that builds every table is tools/crash-analysis.py; it downloads the same public files.

How to cite

Oakland Accident Care, “Oakland’s 18 speed-camera blocks logged about 19 injury crashes a year before the cameras: too few to measure a change yet.” November 1, 2026, https://oaklandaccidentcare.com/oakland-crash-data/speed-camera-sites. Data: California Highway Patrol, California Crash Reporting System (CCRS), California Open Data Portal, downloaded October 26, 2026.

Our tables, CSV files and charts are under Creative Commons Attribution 4.0 (CC BY 4.0): reuse them, including commercially, with credit to Oakland Accident Care and a link to this page. The underlying CCRS records are public domain.

Sources

  1. California Highway Patrol, California Crash Reporting System (CCRS), California Open Data Portal. Crashes, Parties and InjuredWitnessPassengers files, 2021–2026, downloaded October 26, 2026. https://data.ca.gov/dataset/ccrs
  2. City of Oakland, "OaklandStreets" street centerlines, used to place each crash at the intersection named on the report. https://gismaps.oaklandca.gov/server/rest/services/OaklandStreets/FeatureServer/0
  3. City of Oakland (OaklandGIS), "Council District 2022 Revised," adopted February 23, 2022. https://www.arcgis.com/home/item.html?id=b7e06c587b544d8187fe7a0d508f2078
  4. City of Oakland, "Speed Safety Cameras Pilot Program" (site list and FAQ), read October 26, 2026. https://www.oaklandca.gov/Public-Safety-Streets/Traffic-Safety/Speed-Safety-Cameras-Pilot-Program
  5. City of Oakland, "Oakland Speed Safety Cameras Six-Month Report (1/14/26 - 7/15/26)," published August 20, 2026. https://www.oaklandca.gov/Public-Safety-Streets/Traffic-Safety/Speed-Safety-Cameras-Pilot-Program/Oakland-Speed-Safety-Cameras-Six-Month-Report-11426-71526
  6. UC Berkeley SafeTREC, TIMS, notes on SWITRS data ("CHP data entry typically lags by 12–18 months"). https://tims.berkeley.edu/help/SWITRS.php